
この記事は、ConoHa Advent Calendar 2017 14日目の記事です。
こんにちは、鯖管の@kazです。
今日は、Prometheusのexporterを書いて、ConoHa APIからインスタンスの状態を負荷状況を取得してグラフにしてみましょう。
知識
ConoHa
言わずと知れた、応援団長の美雲このはちゃんがかわいいVPSサービスです。

- 初期費用なし
- 全部SSD
- OpenStackベース
などなど、なかなかイケてるサービスです。
traPでも、ConoHaのVPSをお借りしています。
Prometheus
Goで書かれたオープンソースのイケてる監視ツールです。
最近流行っている?気がする?

- バイナリ単体で動く
- Go最高ですね
- exporterによって様々なメトリクスに対応
- exporterを書くとカスタムメトリクスが(そこそこ)簡単に収集できる
Promtheusは、メトリクスをいろんなところから収集してくるPrometheus本体と、
あちこちでメトリクスを公開しているexporterからなります。
Prometheusがexporterを叩いて回って、メトリクスを溜めてくれる形になっています。
マシンの情報を集める公式のnode_exporterをはじめとして、
コミュニティによってたくさんのexporterが公開されています。
ポピュラーなソフトウェアの監視ならだいたいexporterがあるので、助かります。
あとこれは余談ですが、ボクは今年の夏にGMOペパボのインターンシップで100台↑の物理サーバが動いてるサービスにPrometheusによる監視システムを導入する課題をやって、そこでPromethteusとかInfrastructure as Codeとかを叩き込まれました。
GMOペパボ、面白い会社なのでインターンとかオススメです。
やること
ConoHaは、APIでインスタンスのCPU使用率とかが取れるので、これを取得してPrometheusに渡すexporterをGoで書いてみます。
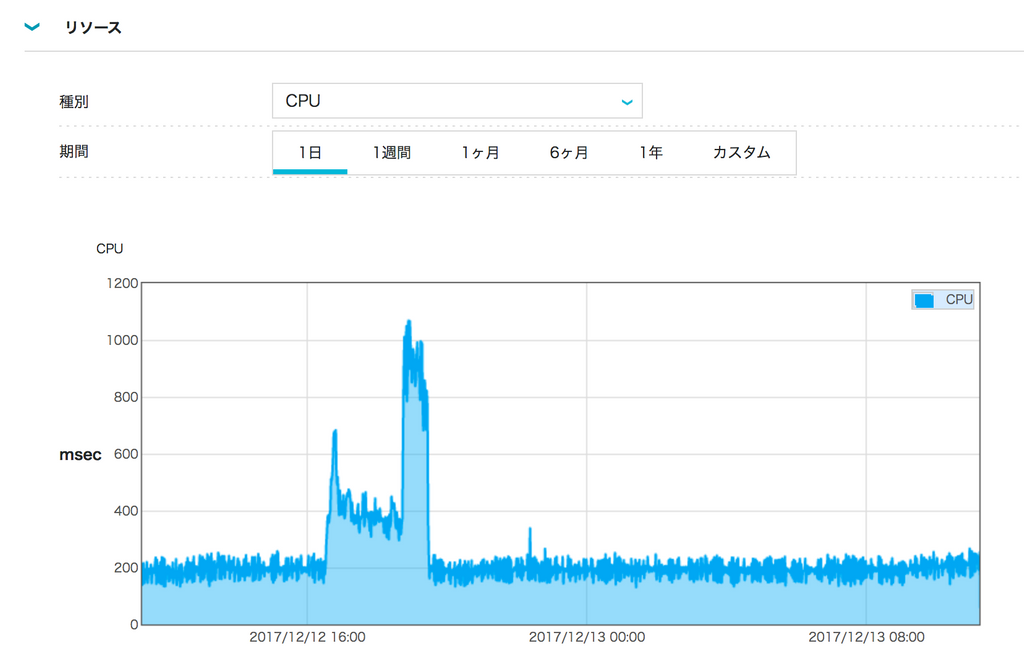
ところで、ConoHaコントロールパネルには先述したAPIから取れるメトリクスを使用した負荷のグラフが最初から表示されているので、グラフを見たいだけならソレを見たほうが良いかと思います。
今回は、 exporterは簡単に作れるよ! ということと、 ConoHaのAPIは便利だよ! ということを紹介するためにやってみます。
exporterを作る
ConoHaのAPIを叩く
APIドキュメントを見ながら……まずは手でやってみましょう。
https://www.conoha.jp/docs/
- Identity APIでトークンを取得
- 取得したトークンを使ってCompute APIからメトリクス取得
するだけです。
トークンの取得
https://www.conoha.jp/docs/identity-post_tokens.html
curlでやってみます。
テナントIDとか、ユーザ情報とかはコントロールパネルのAPIから見れます。
curl -i -X POST \
-H "Accept: application/json" \
-d '{"auth":{"passwordCredentials":{"username":"ConoHa","password":"paSSword123456#$%"},"tenantId":"487727e3921d44e3bfe7ebb337bf085e"}}' \
https://identity.tyo1.conoha.io/v2.0/tokens
HTTP/1.1 200 OK
Date: Mon, 08 Dec 2014 02:40:56 GMT
Server: Apache
Content-Length: 4572
Content-Type: application/json

{
  "access": {
    "token": {
      "issued_at": "2015-05-19T07:08:21.927295",
      "expires": "2015-05-20T07:08:21Z",
      "id": "35941e7df872405d84e5b026dba8323c",
      "tenant": {
        "name": "example00000000",
        "enabled": true,
        "tyo1_image_size": "550GB",
          }
        ],
        "endpoints_links": [],
        "type": "mailhosting",
        "name": "Mail Hosting Service"
      },
...
返ってきたJSONのaccess.token.idがトークン文字列になります。
コレをX-Auth-Tokenヘッダーにセットすると、他のAPIが叩けるようになります。
インスタンス情報を取得
https://www.conoha.jp/docs/compute-get_vms_list.html
ここで得られるサーバIDを利用して、負荷状況を問い合わせます。
curl -i -X GET \
-H "Accept: application/json" \
-H "X-Auth-Token: 35941e7df872405d84e5b026dba8323c" \
https://compute.tyo1.conoha.io/v2/1864e71d2deb46f6b47526b69c65a45d/servers
HTTP/1.1 200 OK
Date: Tue, 09 Dec 2014 03:03:08 GMT
Server: Apache
Content-Length: 691
Content-Type: application/json

{
    "servers": [
        {
            "id": "e25b3611-96df-4514-a54b-7729aec48dc1",
            "links": [
                {
                    "href": "https://compute.tyo1.conoha.io/v2/1864e71d2deb46f6b47526b69c65a45d/servers/e25b3611-96df-4514-a54b-7729aec48dc1",
                    "rel": "self"
                },
                {
                    "href": "https://compute.tyo1.conoha.io/1864e71d2deb46f6b47526b69c65a45d/servers/e25b3611-96df-4514-a54b-7729aec48dc1",
                    "rel": "bookmark"
                }
            ],
            "name": "server1"
        },
...
ポート一覧取得
https://www.conoha.jp/docs/compute-get_attached_ports_list.html
各インスタンスが持っているポートの一覧を確認しておきます。
このport_idは、インタフェースのトラフィック情報を取得する際に必要になります。
curl -i -X GET \
-H "Accept: application/json" \
-H "X-Auth-Token: 35941e7df872405d84e5b026dba8323c" \
https://compute.tyo1.conoha.io/v2/1864e71d2deb46f6b47526b69c65a45d/servers/e25b3611-96df-4514-a54b-7729aec48dc1/os-interface
HTTP/1.1 200 OK
Date: Wed, 10 Dec 2014 04:31:00 GMT
Server: Apache
Content-Length: 364
Content-Type: application/json

{
    "interfaceAttachments": [
        {
            "fixed_ips": [
                {
                    "ip_address": "133.130.49.xxx",
                    "subnet_id": "0569c47a-d349-4a23-a45b-ae9a50d9d847"
                },
                {
                    "ip_address": "2400:8500:1301:727:133:130:49:xxxx",
                    "subnet_id": "6ead51c1-582a-49ef-8026-203744c8402d"
                }
            ],
            "mac_addr": "02:01:85:82:31:a3",
            "net_id": "d3ae282c-3c79-4bb6-ae9d-40318bc1059e",
            "port_id": "51a11bb6-b569-4158-b716-8564a85fb1c4",
            "port_state": "ACTIVE"
        }
    ]
}
メトリクス取得
では、いよいよメトリクスを取得します。
先ほど確認したサーバIDとポートIDを使用します。
https://www.conoha.jp/docs/compute-get_cpu_utilization_graph.html
https://www.conoha.jp/docs/compute-get_disk_io_graph.html
https://www.conoha.jp/docs/compute-get_interface_traffic_graph.html
curl -i -X GET \
-H "Accept: application/json" \
-H "X-Auth-Token: 35941e7df872405d84e5b026dba8323c" \
https://compute.tyo1.conoha.io/v2/1864e71d2deb46f6b47526b69c65a45d/servers/e25b3611-96df-4514-a54b-7729aec48dc1/rrd/interface?port_id=51a11bb6-b569-4158-b716-8564a85fb1c4
{
  "interface": {
    "schema": [
      "unixtime",
      "rx",
      "tx"
    ],
    "data": [
      [
        1426529500,
        70.584,
        0.624
      ],
...
こういった感じで、例えばインタフェースだと受信量と送信量が取れます。
Goでメトリクスを取得する
↑でやったことをGoで書くだけ!
package main

import (
	"bytes"
	"encoding/json"
	"io/ioutil"
	"net/http"
)

type ConohaClient struct {
	http.Client
	region   string
	token    string
	endpoint string
}

func NewClient(region string, tenantId string, username string, password string) (*ConohaClient, error) {
	client := &ConohaClient{region: region}

	// リクエストJSONを組み立てる
	data, err := json.Marshal(map[string]interface{}{
		"auth": map[string]interface{}{
			"passwordCredentials": map[string]string{
				"username": username,
				"password": password,
			},
			"tenantId": tenantId,
		},
	})
	if err != nil {
		return nil, err
	}

	// トークン発行リクエスト
	resp, err := client.Post("https://identity."+region+".conoha.io/v2.0/tokens", "application/json", bytes.NewReader(data))
	if err != nil {
		return nil, err
	}
	defer resp.Body.Close()

	// レスポンスボディを取得
	respBytes, err := ioutil.ReadAll(resp.Body)
	if err != nil {
		return nil, err
	}

	// JSONを読む
	respData := make(map[string]interface{})
	if err := json.Unmarshal(respBytes, &respData); err != nil {
		return nil, err
	}

	// 値にアクセス(型アサーションがメンドウだったら、構造体を定義して読ませると良い感じになります。)
	access := respData["access"].(map[string]interface{})
	token := access["token"].(map[string]interface{})
	serviceCatalog := access["serviceCatalog"].([]interface{})

	// トークンを取得
	client.token = token["id"].(string)

	// Compute APIのエンドポイントを取得
	for _, service := range serviceCatalog {
		svcMap := service.(map[string]interface{})
		if svcMap["type"].(string) == "compute" {
			client.endpoint = svcMap["endpoints"].([]interface{})[0].(map[string]interface{})["publicURL"].(string)
			break
		}
	}

	return client, nil
}

func (cc *ConohaClient) get(path string) ([]byte, error) {
	// Compute APIにGETリクエストを飛ばす
	req, err := http.NewRequest("GET", cc.endpoint+path, nil)
	if err != nil {
		return nil, err
	}

	// ヘッダーにトークンをセットする
	req.Header.Set("X-Auth-Token", cc.token)
	resp, err := cc.Do(req)
	if err != nil {
		return nil, err
	}
	defer resp.Body.Close()

	// レスポンスボディを返す
	return ioutil.ReadAll(resp.Body)
}

// JSON受取用
type ServersResponse struct {
	Servers []Server
}
type Server struct {
	ID         string
	Name       string
	Interfaces []Interface
}

// JSON受取用
type InterfaceResponse struct {
	InterfaceAttachments []Interface
}
type Interface struct {
	PortID  string `json:"port_id"`
	MacAddr string `json:"mac_addr"`
}

func (cc *ConohaClient) Servers() ([]Server, error) {
	// インスタンス一覧情報を取得
	resp, err := cc.get("/servers")
	if err != nil {
		return nil, err
	}

	// JSONを読む
	var sResp ServersResponse
	if err := json.Unmarshal(resp, &sResp); err != nil {
		return nil, err
	}

	servers := []Server{}
	for _, s := range sResp.Servers {
		// インスタンスにくっついてるインタフェースの情報を取得する
		resp, err := cc.get("/servers/" + s.ID + "/os-interface")
		if err != nil {
			return nil, err
		}

		// JSONを読む
		var iResp InterfaceResponse
		if err := json.Unmarshal(resp, &iResp); err != nil {
			return nil, err
		}

		// Server構造体に情報を付け加える
		s.Interfaces = iResp.InterfaceAttachments
		servers = append(servers, s)
	}

	return servers, nil
}

// JSON受取用
type UsageResponse struct {
	CPU       Usage
	Disk      Usage
	Interface Usage
}
type Usage struct {
	Schema []string
	Data   [][]float64
}

func (cc *ConohaClient) CpuUsage(s Server) (map[string]float64, error) {
	// メトリクス取得
	resp, err := cc.get("/servers/" + s.ID + "/rrd/cpu")
	if err != nil {
		return nil, err
	}

	// JSONを読む
	var uResp UsageResponse
	if err := json.Unmarshal(resp, &uResp); err != nil {
		return nil, err
	}

	// データ整形
	data := uResp.CPU.Data[len(uResp.CPU.Data)-3]
	usage := make(map[string]float64)
	for i, label := range uResp.CPU.Schema {
		usage[label] = data[i]
	}

	return usage, nil
}
func (cc *ConohaClient) DiskUsage(s Server) (map[string]float64, error) {
	// メトリクス取得
	resp, err := cc.get("/servers/" + s.ID + "/rrd/disk")
	if err != nil {
		return nil, err
	}

	// JSONを読む
	var uResp UsageResponse
	if err := json.Unmarshal(resp, &uResp); err != nil {
		return nil, err
	}

	// データ整形
	data := uResp.Disk.Data[len(uResp.Disk.Data)-3]
	usage := make(map[string]float64)
	for i, label := range uResp.Disk.Schema {
		usage[label] = data[i]
	}

	return usage, nil
}
func (cc *ConohaClient) InterfaceUsage(s Server, i Interface) (map[string]float64, error) {
	// メトリクス取得
	resp, err := cc.get("/servers/" + s.ID + "/rrd/interface?port_id=" + i.PortID)
	if err != nil {
		return nil, err
	}

	// JSONを読む
	var uResp UsageResponse
	if err := json.Unmarshal(resp, &uResp); err != nil {
		return nil, err
	}

	// データ整形
	data := uResp.Interface.Data[len(uResp.Interface.Data)-3]
	usage := make(map[string]float64)
	for i, label := range uResp.Interface.Schema {
		usage[label] = data[i]
	}

	return usage, nil
}
Prometheusが読める形式で出力
PrometheusはHTTPを介して情報をやり取りします。
text/plainで所定の形式にフォーマットしたメトリクスを吐くようなWebアプリを作って、URLをPrometheusに教えてあげるだけで、連携が完了してしまいます!手軽ですね。
exporterをどう書くべきか?とか、メトリクスの出力フォーマットとかは、公式のドキュメントが詳しいです。
- https://prometheus.io/docs/instrumenting/writing_exporters/
- https://prometheus.io/docs/instrumenting/exposition_formats/
あと、HAProxyのexporterを参考にしてね!とのこと
https://github.com/prometheus/haproxy_exporter
さらに、Goには公式でexporter用のライブラリが用意されているので、コレに乗っかるだけでだいぶ楽にexporterが書けちゃいます。
https://godoc.org/github.com/prometheus/client_golang/prometheus
今回はGoで作ってるので、↑に乗っかります。
ちなみに、Goじゃない言語で書く場合でも特に難しいことはなくて、単純なフォーマットに従ってテキストを吐き出すだけです。実際に、Go以外の言語で書かれたexporterもたくさんあります。
実装
書きます。
godocの中のサンプルコードもけっこう参考になります。
https://godoc.org/github.com/prometheus/client_golang/prometheus
方針としては、
- prometheus.Collectorを実装します
- 実装したCollectorを
prometheus.Register()する promhttp.Handler()でハンドラを取得して、設定- らくちん!!!
prometheus.Collector実装
https://godoc.org/github.com/prometheus/client_golang/prometheus#Collector
Describe(chan<- *Desc)とCollect(chan<- Metric)の2つのレシーバを実装します。
ハンドラからこれらのレシーバが呼ばれるので、必要に応じてメトリクスを適切に取得して返します。
いずれも引数でchannelが渡されるので、ココに放り込んでいきます。
ConoHa APIに問い合わせるのがそこそこ時間がかかる上に、70秒に1回しかメトリクスが更新されないようなので、70秒に一回APIを叩いて内部のメトリクスデータを更新し、リクエストが来たら保持しているデータを返す形で実装してみました。
見たほうが早いと思うので、コードです↓↓↓
package main

import (
	"log"
	"sync"
	"time"

	"github.com/prometheus/client_golang/prometheus"
)

type ConohaCollector struct {
	*ConohaClient
	*sync.RWMutex
	describes []*prometheus.Desc
	metrics   []prometheus.Metric
	servers   []Server
}

func NewConohaCollector(client *ConohaClient) (*ConohaCollector, error) {
	// インスタンス一覧取得
	servers, err := client.Servers()
	if err != nil {
		return nil, err
	}

	// 提供するメトリクスの情報などを定義
	return &ConohaCollector{
		client,
		&sync.RWMutex{},
		[]*prometheus.Desc{
			// NewDescの3番目の引数は可変ラベル(NewConstMetricの最後の可変長引数に対応してる)
			// 4番目のnilには、固定ラベルをprometheus.Labelsで渡せる
			prometheus.NewDesc("conoha_cpu", "CPU usage of ConoHa instance", []string{"instance"}, nil),
			prometheus.NewDesc("conoha_disk", "Disk usage of ConoHa instance", []string{"instance", "rw"}, nil),
			prometheus.NewDesc("conoha_interface", "Interface usage of ConoHa instance", []string{"instance", "mac", "direction"}, nil),
		},
		[]prometheus.Metric{},
		servers,
	}, nil
}

func (cc *ConohaCollector) AutoUpdate() {
	for {
		metrics := []prometheus.Metric{}

		for _, srv := range cc.servers {
			// CPU使用状況を取得
			cpu, err := cc.CpuUsage(srv)
			if err != nil {
				log.Fatal(err)
			}
			metrics = append(metrics, prometheus.MustNewConstMetric(cc.describes[0], prometheus.GaugeValue, cpu["value"], srv.Name))

			// ディスク使用状況を取得
			disk, err := cc.DiskUsage(srv)
			if err != nil {
				log.Fatal(err)
			}
			metrics = append(metrics, prometheus.MustNewConstMetric(cc.describes[1], prometheus.GaugeValue, disk["read"], srv.Name, "read"))
			metrics = append(metrics, prometheus.MustNewConstMetric(cc.describes[1], prometheus.GaugeValue, disk["write"], srv.Name, "write"))

			// インタフェース使用状況を取得
			for _, ifaceDef := range srv.Interfaces {
				iface, err := cc.InterfaceUsage(srv, ifaceDef)
				if err != nil {
					log.Fatal(err)
				}
				metrics = append(metrics, prometheus.MustNewConstMetric(cc.describes[2], prometheus.GaugeValue, iface["rx"], srv.Name, ifaceDef.MacAddr, "rx"))
				metrics = append(metrics, prometheus.MustNewConstMetric(cc.describes[2], prometheus.GaugeValue, iface["tx"], srv.Name, ifaceDef.MacAddr, "tx"))
			}
		}

		// メトリクスデータ更新
		cc.Lock()
		cc.metrics = metrics
		cc.Unlock()

		log.Println("Metrics updated.")

		// 70秒間待機(ConoHa API側の更新間隔)
		<-time.NewTimer(70 * time.Second).C
	}
}

// 内部で保持しているデータを返す
func (cc *ConohaCollector) Describe(ch chan<- *prometheus.Desc) {
	for _, d := range cc.describes {
		ch <- d
	}
}
func (cc *ConohaCollector) Collect(ch chan<- prometheus.Metric) {
	cc.RLock()
	defer cc.RUnlock()

	for _, m := range cc.metrics {
		ch <- m
	}
}
mainでいろいろ登録作業
mainでいろいろ登録します。
ついでに、コマンドライン引数で認証情報とかを取れるようにしました。
package main

import (
	"flag"
	"log"
	"net/http"
	"os"

	"github.com/prometheus/client_golang/prometheus"
	"github.com/prometheus/client_golang/prometheus/promhttp"
)

// インデックスページ用 (Prometheusは別にココを触らないので、お好みで……)
func indexPage(w http.ResponseWriter, r *http.Request) {
	w.Write([]byte(`
		<!DOCTYPE html>
		<html>
		<head>
			<title>ConoHa Exporter</title>
		</head>
		<body>
			<h1>ConoHa Exporter</h1>
			<p><a href="/metrics">Metrics</a></p>
		</body>
		</html>
	`))
}

func main() {
	log.Println("ConoHa exporter started.")

	// コマンドライン引数
	port := flag.String("port", os.Getenv("PORT"), "Port number to listen on")
	region := flag.String("region", "tyo1", "ConoHa region")
	tenantId := flag.String("tenant-id", "", "ConoHa tenant ID")
	username := flag.String("username", "", "ConoHa API user name")
	password := flag.String("password", "", "ConoHa API user password")
	flag.Parse()

	if *port == "" {
		*port = "3000"
	}

	// ConoHa APIクライアントを作成
	client, err := NewClient(*region, *tenantId, *username, *password)
	if err != nil {
		log.Fatal(err)
	}

	// 実装したCollectorのを作成
	exporter, err := NewConohaCollector(client)
	if err != nil {
		log.Fatal(err)
	}

	// Collectorをprometheusライブラリに登録
	if err := prometheus.Register(exporter); err != nil {
		log.Fatal(err)
	}

	// 定期的にメトリクスを更新する
	go exporter.AutoUpdate()

	// HTTPでメトリクスを出力
	http.HandleFunc("/", indexPage)
	http.Handle("/metrics", promhttp.Handler())
	log.Fatal(http.ListenAndServe(":"+*port, nil))
}
Prometheusと連携
ということで、exporterが完成しました。
試しにexporterを起動してブラウザから http://localhost:3000/metrics を開いてみると、こんな感じに値が取れているのが確認できます。
# HELP conoha_cpu CPU usage of ConoHa instance
# TYPE conoha_cpu gauge
conoha_cpu{instance="133-xxx-xxx-xxx"} 2.0442857143e+08
conoha_cpu{instance="150-xxx-xxx-xxx"} 0
conoha_cpu{instance="163-xxx-xxx-xxx"} 2.0891428571e+08
# HELP conoha_disk Disk usage of ConoHa instance
# TYPE conoha_disk gauge
conoha_disk{instance="133-xxx-xxx-xxx",rw="read"} 3042.7428571
conoha_disk{instance="133-xxx-xxx-xxx",rw="write"} 26214.4
conoha_disk{instance="150-xxx-xxx-xxx",rw="read"} 0
conoha_disk{instance="150-xxx-xxx-xxx",rw="write"} 21252.388571
conoha_disk{instance="163-xxx-xxx-xxx",rw="read"} 96560.274286
conoha_disk{instance="163-xxx-xxx-xxx",rw="write"} 163044.20571
# HELP conoha_interface Interface usage of ConoHa instance
# TYPE conoha_interface gauge
conoha_interface{direction="rx",instance="133-xxx-xxx-xxx",mac="02:xx:xx:xx:xx:xx"} 3216.7514286
conoha_interface{direction="rx",instance="133-xxx-xxx-xxx",mac="fa:xx:xx:xx:xx:xx"} 219461.03714
conoha_interface{direction="rx",instance="150-xxx-xxx-xxx",mac="02:xx:xx:xx:xx:xx"} 25609.614286
conoha_interface{direction="rx",instance="163-xxx-xxx-xxx",mac="02:xx:xx:xx:xx:xx"} 7148.8757143
conoha_interface{direction="tx",instance="133-xxx-xxx-xxx",mac="02:xx:xx:xx:xx:xx"} 24136.652857
conoha_interface{direction="tx",instance="133-xxx-xxx-xxx",mac="fa:xx:xx:xx:xx:xx"} 3050.4942857
conoha_interface{direction="tx",instance="150-xxx-xxx-xxx",mac="02:xx:xx:xx:xx:xx"} 10641.874286
conoha_interface{direction="tx",instance="163-xxx-xxx-xxx",mac="02:xx:xx:xx:xx:xx"} 30389.604286
...
それでは、Prometheusに設定を追加してConoHaメトリクスを取得させてみます
prometheus.ymlを編集します。
global:
  scrape_interval: 5s
  evaluation_interval: 5s

scrape_configs:
  - job_name: conoha
    static_configs:
      - targets:
        - localhost:3000
http://localhost:9090/targets で正しく連携できているかをチェックできます。
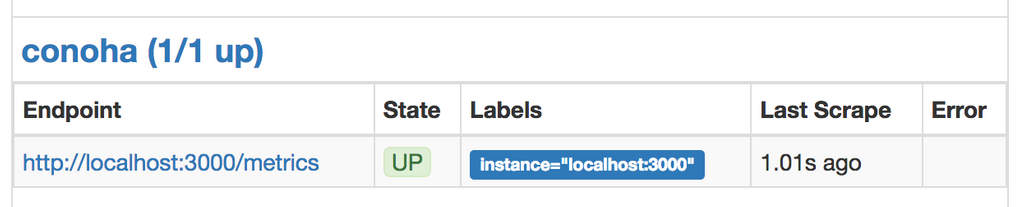
よさそう。
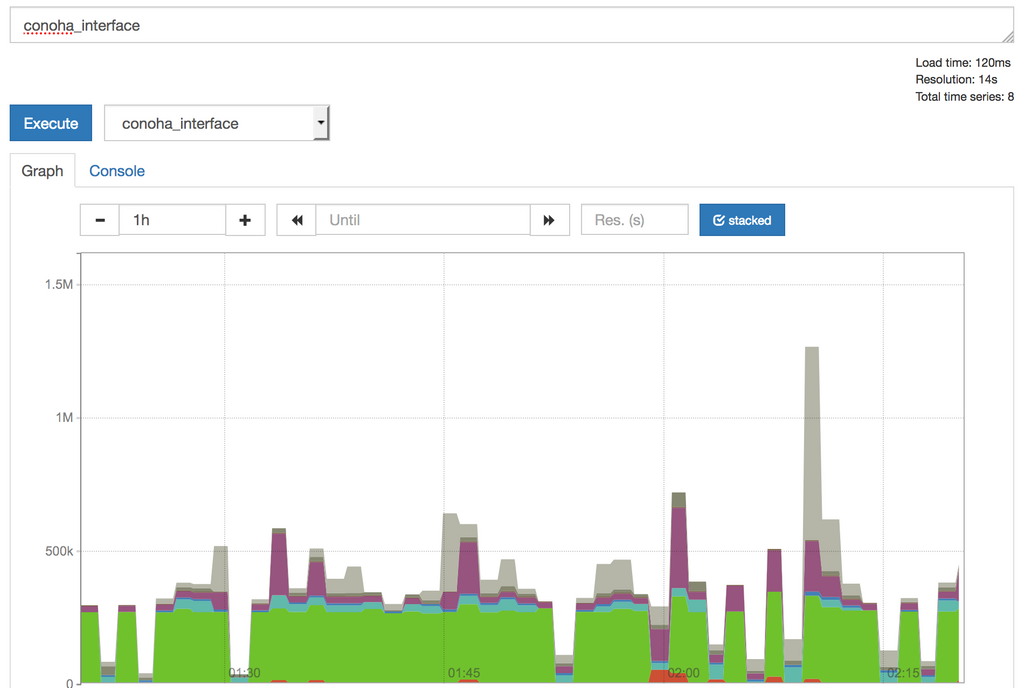
グラフもそれっぽいです。
おわり
ということで、ConoHa APIからメトリクスを引っ張ってくるPrometheus向けexporterを書いてみました。
ConoHa APIを触る際や、exporter開発時に参考になれば幸いです。
書いたconoha_exporterの全コード
https://github.com/kaz/conoha_exporter
README.mdにいろいろ説明を書いてあります。
実用を考慮してないので、トークンの更新をしてなかったりとかいろいろテキトウです。
参考程度にどうぞ……
その他ConoHaっぽい記事
ConoHaでArchLinuxを動かすまで
/post/39/
ConoHaのDNS APIをCLIから叩くやつを作った
https://narusejun.com/archives/14/